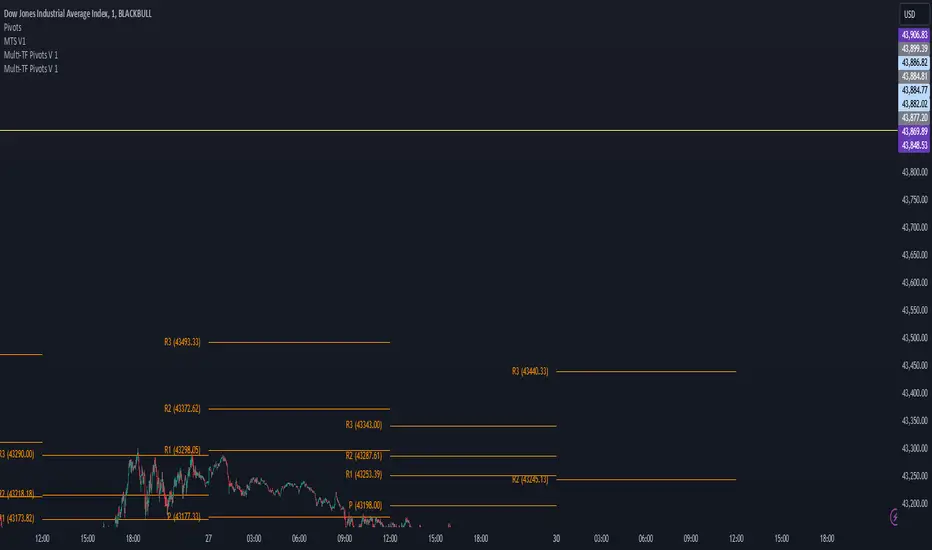
M-SQUEEZEScript for Swing Trading. It use the following indicators:
- SQUEEZE MOMENTUM INDICATOR (LAZYBEAR)
- RSI VOLUME WEIGHTED (LAZYBEAR)
- PARABOLIC SAR
Settings for OANDA:SPX500USD at 2H
Cerca negli script per "swing trading"
Relative Vigor IndexHere we are looking at a trend strength indicator based on the Relative Vigor Index(RVI). The RVI measures trend strength by comparing the open-close and high-low ranges for the current and three most recent periods. As a zero-centered oscillator, the RVI oscillates above and below zero to signal the strength of the trend.
As there are different ways to interpret the RVI, we have included 3 different modes for traders to choose from in the input option menu:
1. Zero-Crossing:
The RVI Histogram will turn green when it crosses above zero and red when it crosses below. Therefore, a green RVI means the trend is bullish and red means bearish. This mode is better for longer-term swing trading in comparison to the other 2 modes.
2. Increasing / Decreasing:
The RVI histogram will turn green when it is increasing(rvi >= rvi ) and red when it is decreasing. A green RVI is viewed as a bullish signal and red means bearish. This mode is a good middle-ground between the Zero-Crossing and Signal Comparison modes.
3. Signal Comparison:
Here, the RVI is compared to its signal line. If the RVI is greater than its signal line, the histogram is green, indicating a bullish trend, while red means bearish. This mode is preferred for scalping.
Hope everyone finds this one useful!
You can check out our other invite only studies/strategies at our website: profitprogrammers.com
[TH] MA CloudThis script uses concept of ichmok cloud to SMA . ( But the details are different )
It is useful for 1-3 month swing trading (if open market is 5days in a week).
* Cloud
Simple Moving Average ( SMA ) 20 days & 60 days were used to make cloud region( green, red cloud )
- 20 days, 60days SMA were translated to 20days future from now ( =SMA Leading span 1,2 )
- if 20days sma > 60days sma => green
- if 20days sma < 60days sma => red
- if close price < cloud => The bigger red cloud means stronger resistance
- if close price > cloud = > The bigger green cloud means stronger support
* Leading Span (Most important)
Instead of using lagging span, I used leading span.
We can predict 20 days sma's direction with this leading span & current price(close price)
- if close price makes Dead Cross over leading span & close price < 20days sma
=> 20days sma heading down soon
- if close price makes Golden Cross over leading span & close > 20days sma
=> 20days sma heading up soon
* buy
Buy IF 20days sma heading up soon & close price >= green cloud ( even better if 20days sma >= 60days sma )
OR IF 20days sma heading up soon & close price < red cloud & cloud is small ( low success rate )
Uzbekinvest 20-50-200 EMA Swing Trading Strategy in 15 min timefI made some little changes to Philakone's EMA trading strategy. I just adjusted to myself to get signals earlier than originally made.
Reaction pointShows the pivot high and pivot low to analyse reaction swing...theory is mentioned in john crane book :"Advanced Swing Trading "...Any further modifications are welcome....
Stochastic Bollinger StrategyBollinger defaults = 20, close, 2
Stochastic defaults = 13, 5, 5
Buy Signal (GREEN triangle):
BULLISH candle formed
Candle OPEN is LESS than LOWER Bollinger Band
Stochastic (K) is LESS than 20
Sell Signal (RED triangle):
BEARISH candle formed
Candle OPEN is GREATER than UPPER Bollinger Band
Stochastic (K) is GREATER than 80
Read more about the strategy and where to set buy stops and sell stops here: swing-trading-strategies.com
BTC Swinger v1Daily interval swing trading algorithm based on momentum techniques using ATR Stops. Made by Kory Hoang from Stably.
Shout out to the Advanced Crypto Asset Trading crew! ;)
Combined RSI and MA Alert Triggersrsi indicator whith conditional moving average settings for swing trading when market price is above certain moving averages
testing a simple for fun, not intended to be financial advise, do your own research :)
enjoy!
Swing Hull/SonicR/EMA/Linear Regression StrategyA Swing trading strategy that use a combination of indicators, linear regression for target, hull for overall direction, sonicR for entering the martket!
Linda Raschke's Holy GrailAnother script based on Linda Raschke's strategy with the same name from her book about swing trading.
EMA 9/12/21/55 in one placeBased on --> // Inspired by Philakone's 55 EMA Swing Trading Strategy
- Increased EMA line visibility
- Removed buy/sell arrow
Philakone 55 EMA Swing Trading StrategyThis strategy was inspired by Philkone Crypto's "Lesson 12: Let's Learn Advanced 55 EMA Strategy" video.
steemit.com
Supports Buy and Sell Condition alerts and displays arrows on the chart.
[naoligo] 12x MA DT (5, 15, 30 & 60)This indicator is based on "Generic 8x MA Plotter", by @LazyBear.
It is also based on my own indicator "10x MA (H, D, W, M)", which is good for Swing Trading and/or Position.
This one is focused in daytrade and it will plot three Moving Averages based on current time interval (under 5 minutes) and nine based on chosen periods by 5, 15, 30 and 60 minutes. You will be able to see where is, for example, a 50 period's SMA of 15 minutes when using a 2 minutes time interval chart. I find it very useful to analyze, in a snap, possible price ranges and enter/exit points. All reference values are from setups known and used by daytraders.
you can choose between EMA or SMA (default: SMA) for each time interval, that are distributed in:
3x MA current time interval;
3x MA 5 minutes;
2x MA 15 minutes;
2x MA 30 minutes;
2x MA 60 minutes.
I've tried to keep the code as simple as possible, so you can increase the number of MA or modify the type for each time interval.
Cons: Use it wisely, because if you choose to plot all the 12 Moving Averages, it will may consume a lot of your navigator resources.
Enjoy!
TEMA Cross with Renko BoxesThis is a pretty simple microprofit strategy with a couple twists:
Renko boxes plot fixed price changes over variable amounts of time, rather than plotting varying price changes over fixed amounts of time like conventional candlesticks. This makes price trends much simpler to identify, and that's what we ultimately care about.
Triple exponential moving average is a moving average that has considerably less lag compared to a regular EMA.
Buying and selling is simple, buy when TEMA crosses above a short-term SMA, and sell when TEMA crosses below the short-term SMA. The use of Renko candles makes these crosses more reliable, and TEMA gives us more optimal entries and exits.
We also avoid buying if the price is above a longer-term smoothed moving average. This is an attempt to avoid bags but it means we might miss a few trades right after a pump.
Also included are
avg_protection -- if > 0 we only buy if it will reduce our average bought price
gain_protection -- if >0 only sell once we have met our min_gain
I prefer to use a fixed price increment (traditional Renko) rather than ATR. I start with an increment roughly 0.1% of the current price level and see how the chart looks. It's better if the chart has a lot of big zig-zags. Larger price increments will be less noisy and more reliable, and is more suited for longer-term swing trading.
This strat needs to be used with tiny tiny order sizes and can definitely be improved upon. It does not maximize gains on very rapid pumps.
It basically accumulates a long position with many small buys over and over when the price is below average, until there is an opportunity to sell for a profit. In a pump there is not a lot of time to re-accumulate a position after the first sell.
Francesco's Ultimate Moving Average-MTFMoving Averages for potential upside buys. Features three different moving averages to indicate uptrends and downtrends for swing trading.
Swing Hull/rsi/EMA StrategyA Swing trading strategy that use a combination of indicators, Hull average to get the trend direction, ema and rsi do the rest, use it are your own risk expecially at the end of any hull trend
Past Performance Does Not Guarantee Future Results
JPY GBP ROCsRate of change of most volatile JPY and GBP pairs. All pairs ending in JPY are red except GBPJPY (colored yellow --currently most volatile 7/2016). GBPNZD is blue, the other GBP pairs are green, lime and teal. GBPJPY and GBPNZD are my favorite day trading / swing trading pairs. This script allows me to see the action of the most volatile and liquid pairs on one screen. JPY pairs (ex-GBPJPY) are all red so that I see the flow of JPY not so much each pair and its name. Global movement of JPY is what I am after. Same for the coloring of GBP pairs as green expect GBPNZD as blue. ***** EURGBP is plotted as an opposite (with a negative in front of its sma. EURGBP is extremely correlated to GBPNZD, I decided to plot it also.
SPY Master v1.0This is a simple swing trading algorithm that uses a fast RSI-EMA to trigger buy/cover signals and a slow RSI-EMA to trigger sell/short signals for SPY, an xchange-traded fund for the S&P 500.
The idea behind this strategy follows the premise that most profitable momentum trades usually occur during periods when price is trending up or down. Periods of flat price actions are usually where most unprofitable trades occur. Because we cannot predict exactly when trending periods will occur, the algorithm basically bets money on all trade opportunities during all market conditions. Despite an accuracy rate of only 40%, the algorithm's asymmetric risk/reward profile allows the average winner to be 2x the average loser. The end result is a positive (profitable) net payout.
TRADING RULES:
Buy/Cover = EMA3(RSI2) cross> 50
Sell/Short = EMA5(RSI2) cross< 50
BACKTEST SETTINGS:
- Period = March 2011 - Present
- Initial capital = $10,000
- Dividends excluded
- Trading costs excluded
PERFORMANCE COMPARISON:
There are 657 trades, which means 1,314 orders. Assuming each order costs $2 (what I pay for at Interactive Brokers), total trading costs should be $2,628.
-SPY (buy & hold) = 132.73 ---> 193.22 = +45.57% (dividends excluded)
-SPY Master v1.0 = $12,649 - $2,628 = $10,021 = +100.21%
DISCLAIMER: None of my ideas and posts are investment advice. Past performance is not an indication of future results. This strategy was constructed with the benefit of hindsight and its future performance cannot be guaranteed.
Momentum VMA KITKAT CROSS v2*Update Momentum VMA KITKAT CROSS v2
triple MVMA (Hull MA) with integrated Kitkat
Madrid Trend TradingMadrid Trend Trading is an indicator that shows Momentum direction and strength based on a given trend (pair of MA's). It is useful to detect the direction of the trend, Momentum divergences with the trend and possible trend reversals.
Parameters
1. Fast MA Length
2. Slow MA Length
3. Signal Length
Trading with MTT
1. MTT > 0 and increasing (Lime) : Long position
2. MTT > 0 and decreasing (Green) : entry/exit long position, take profits or plan an entry
3. MTT < 0 and decreasing (Red) : Short position
4. MTT <0 and increasing (Maroon) : entry/exit short position, take profits or plan entry
This shows the market waves, it's a good indicator for swing trading since it shows the change of direction of the trend, signals profit areas and entry/exit regions. Change in the direction of the trend can be spotted by the cross over the zero line or by trend divergences, H-H in the trend and L-H in the MTT indicator means a downtrend is close. L-L in the trend and H-L in the indicator means an uptrend is forming.
There is a bar in the zero line that shows the momentum direction, simple, green it's increasing, red, it's decreasing.
This indicator is meant to be a companion of the MTS indicator. When combined MTS shows the direction and strength of the trend, meanwhile MTT shows if the trend is weakening, gaining strength, confirms continuation or warns a reversal.
What I look from my indicators is to create a tool that filters out as much noise as possible without losing much sensitivity, they have to be easy to tune and simple to analyze, so I normally use contrasting colors, using cold colors for long positions and warm colors for short positions. I try to use the least possible number of parameters and the defaults have been set after several months of testing in Beta mode against hundreds of charts before publishing them.
I hope this effort can help you to have a simpler point of view of the market.